Vercel Integration
Every deployment, every build, every Web Vital — without opening the Vercel dashboard.
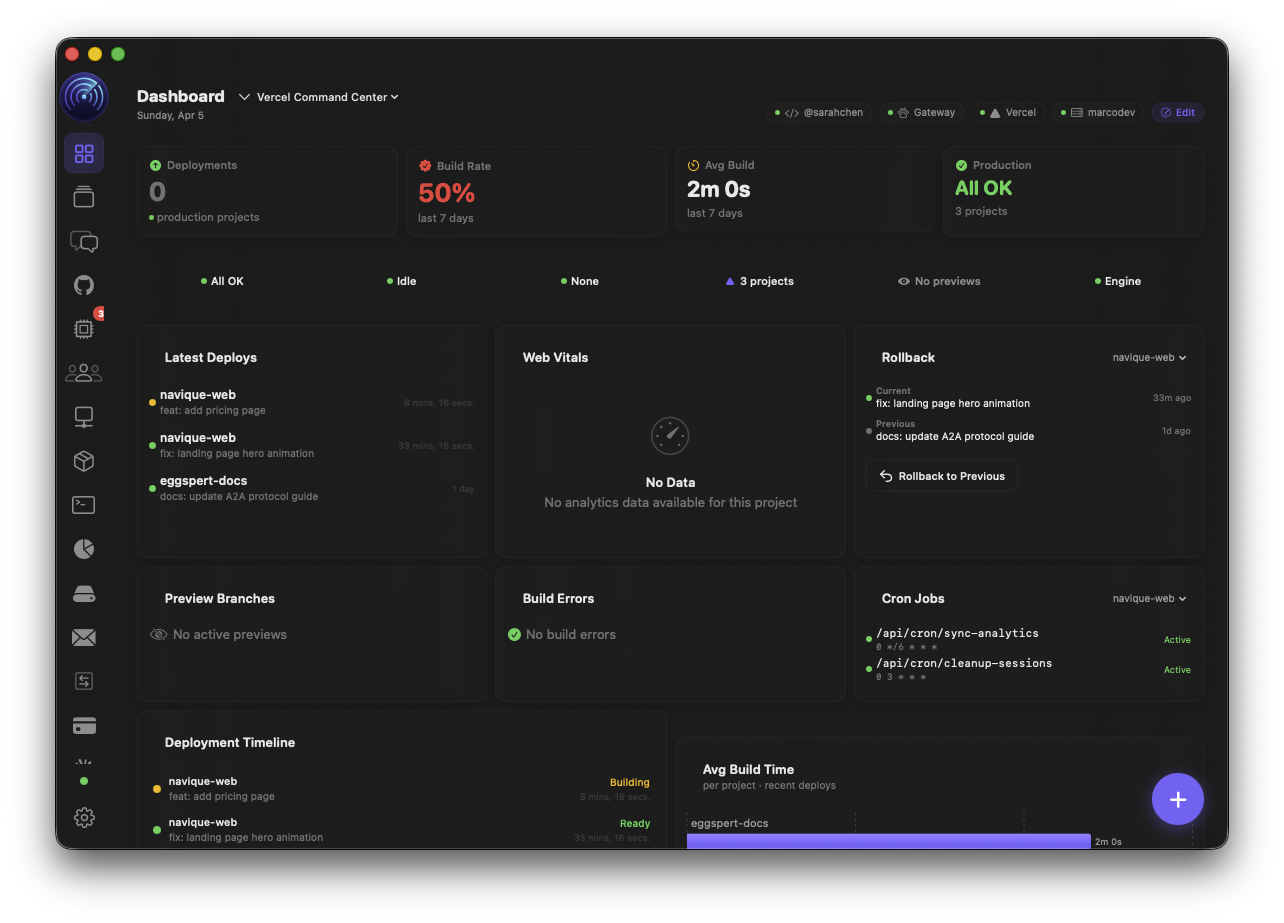
Navique connects to Vercel via a Bearer access token and provides full visibility across all your projects: real-time deployment status, build logs, preview deploys with branch context, Web Vitals metrics, environment variable management, custom domain health, Edge Config read/write, and rollback candidates. The Deployment Radar view is the primary Vercel UI surface, with 18 dashboard components available for the Command Centre. Cancel builds, trigger redeploys, and manage env vars — all without leaving the app.
| Mac | Desktop WidgetsV2
macOS 14 Sonoma+ · Coming in Navique V2
Technical Capabilities
- 01.
Deployment Timeline & Status
Scrollable timeline of recent deployments across all projects. Each entry shows deployment state (Ready, Building, Error, Queued, Cancelled), commit message and SHA from GitHub metadata, branch name, timestamp, creator, and deployment URL. Production and preview deployments distinguished visually. Active builds surface with 30-second polling. Error deployments show error code and message.
- 02.
Build Time Trends & Deploy Frequency
Line chart showing build duration over the last 30 production deployments. Build time calculated from buildingAt to ready timestamps. Deploy frequency bar chart shows deploys per day over the past 30 days, stacked by target (production vs preview). Spot regressions in build performance and understand team shipping cadence at a glance.
- 03.
Web Vitals Monitoring
Latest deployment check output with Web Vitals scores: First Contentful Paint (FCP), Largest Contentful Paint (LCP), Cumulative Layout Shift (CLS), Total Blocking Time (TBT), and Virtual Experience Score. Delta from previous deployment shown for each metric. Colour-coded score rings — green, yellow, red — based on Core Web Vitals thresholds. Catch performance regressions the moment they deploy.
- 04.
Preview Deploys & Branch Context
Active preview deployments listed with branch name, PR info extracted from GitHub commit metadata, build state, and preview URL. Open preview URLs directly from the list. Cancel in-progress preview builds. Essential for reviewing feature branches and staging environments without switching to the Vercel dashboard.
- 05.
Environment Variables & Domain Health
Full environment variable management: list all env vars per project with type (plain, secret, encrypted, system), target scope (production, preview, development), and branch-specific overrides. Create, update, and delete env vars. Domain health widget shows all custom domains grouped by project with verification status and apex name. Catch DNS misconfigurations before they cause downtime.
- 06.
Edge Config & Rollback Candidates
List of Edge Configs with item count and last modified date. Expand to see key-value pairs. Edit item values and create new items directly. Rollback Candidates card lists deployments marked safe for quick rollback — one click to promote a previous deployment back to production.
- 07.
Build Errors & Logs
Recent failed deployments listed with error code, error message, and truncated build log (last 20 lines). OOM reports surfaced when applicable. Build event stream available for any deployment with type markers (build, proxy, delimiter) and timestamp. Diagnose build failures without leaving your workflow.
- 08.
Dashboard Widgets & Badges
18 dashboard components for the Command Centre: Status Badge, Deploy Count Badge, Deploys Stat Card, Latest Deploy Card, Build Status Card, Project Stats Card, Env Vars Card, Deployment Timeline Widget, Project Overview Widget, Domain Health Widget, Build Time Chart, Deploy Frequency Chart, Web Vitals Card, Rollback Candidates Card, Build Errors Card, Preview Deploys Widget, Edge Config Widget, and Function Regions Card. Drag any onto your layout.