Dashboard Builder
80+ widgets. 16 integration categories. 8 preset layouts. Drag, drop, resize, name, save. Your command centre, your way.
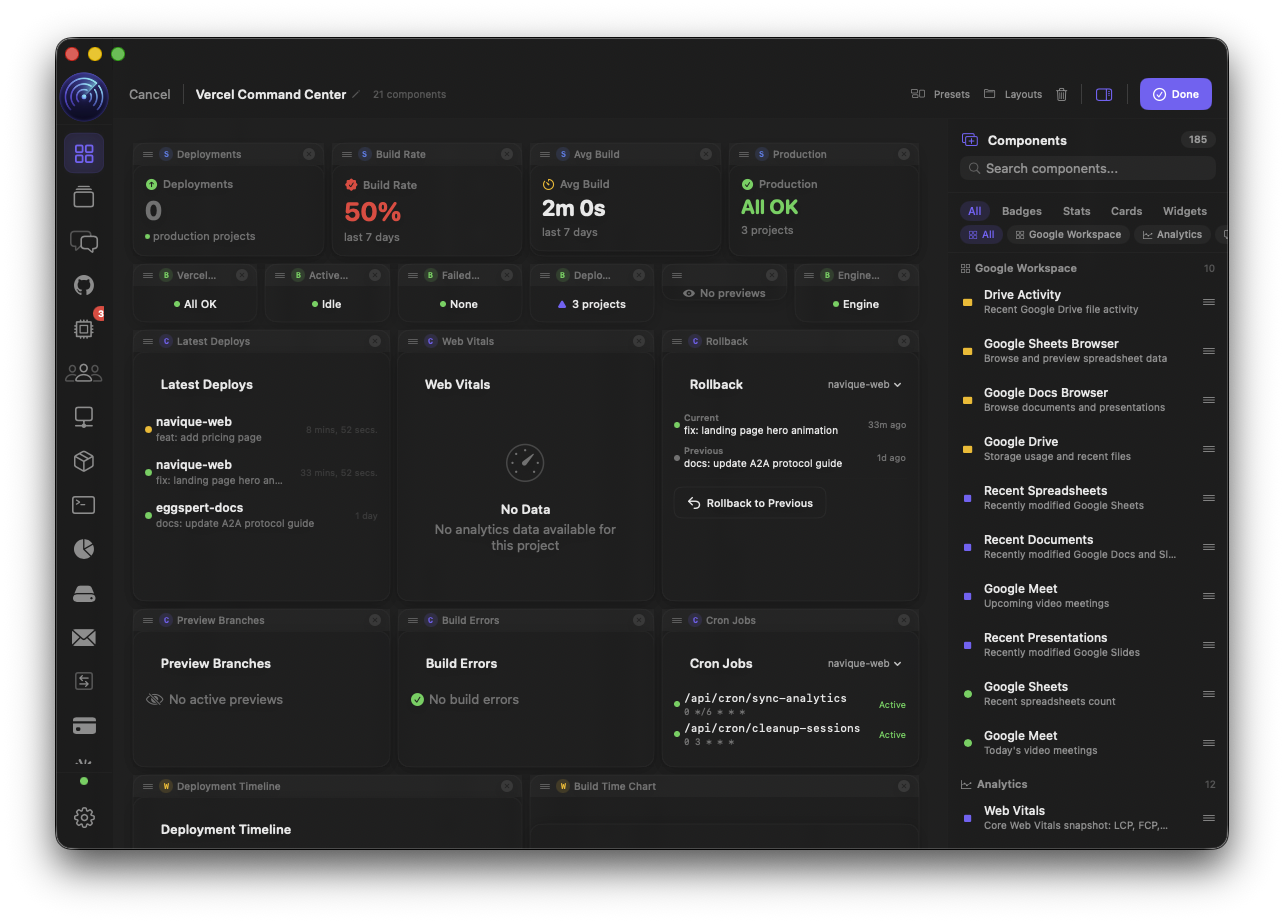
The Dashboard Builder transforms your command centre into a fully interactive canvas. Drag widgets from a searchable palette organised by integration category — Vercel build stats next to Stripe MRR next to GitHub PR counts next to Sentry error rates. Resize anything. Save named layouts for different workflows. Switch between 8 pre-built presets with a single click. Every widget pulls live data. Every layout persists across launches.
“Monday morning. I open Navique and my SaaS Founder preset is already loaded — Stripe MRR, Vercel deploy health, GitHub PRs, Sentry errors, PostHog DAUs. The Morning Briefing card tells me 2 PRs merged overnight and a Stripe webhook failed. I click the Agent Pulse strip — one agent is running, $0.42 spent today. By 9:05 I know the state of the entire business without opening a single browser tab.”
Technical Capabilities
- 01.
Drag-and-Drop Grid Editor
Enter edit mode and the dashboard becomes an interactive canvas. A searchable palette slides in from the right, organised by integration category. Drag any widget onto the grid and resize it freely. The palette covers all 16 categories: Vercel, Firebase, Linear, Google Workspace, Supabase, Netlify, Render, Railway, Stripe, Slack, Notion, Sentry, PostHog, GitHub, Weekly Insight, and Engine Status. Clear All resets to a blank canvas. Every change persists immediately.
- 02.
135+ Component Library
The full widget inventory: deployment timelines, build success rates, Web Vitals (LCP, FID, CLS, TTFB, FCP), MRR and ARR trackers, churn rate displays, crash-free rate gauges, DAU trending charts, cycle progress bars, issue roadmaps, storage monitors, auth user counts, and dozens more. Each component is type-safe with compile-time ID validation — no silent render failures from a typo.
- 03.
Quick Stats Row
A row of always-visible stat cards summarising key metrics across the whole stack: open tasks, active agents, connected integrations, weekly commits, Stripe MRR, active customers, Linear open issues, PostHog DAUs, open GitHub PRs, Vercel deploys this week, and Sentry error count.
- 04.
Today's Focus Row
A persistent strip at the top of the dashboard surfacing the five most actionable items right now: pending agent approvals, failing CI runs, open pull requests waiting for review, blocked Kanban tasks, and deployments with degraded health. Each item is a one-click deep link to the relevant view. Everything else is context — this row is the action list.
- 05.
8 Layout Presets
Pre-configured templates for common developer workflows. Deployment-Focused: Vercel build stats, GitHub PRs, deployment health. Sprint-Focused: Linear cycle progress, velocity, milestones. Revenue-Monitoring: Stripe MRR, ARR, churn, customer metrics. SaaS Founder: cross-stack business view. Agent-Centric: agent cost, context window, active sessions. Team Lead: team feed, sprint velocity, PR metrics. DevOps: multi-platform deploy status, Web Vitals, error rates. Full Stack: everything. Apply with one click, customise immediately.
- 06.
Morning Briefing Card
An AI-generated summary card appearing on the dashboard each morning at 9 AM (configurable, togglable). It aggregates overnight activity across all connected integrations — new commits, merged PRs, deployment events, agent runs, Stripe charges, Sentry errors — and distils it into a scannable natural-language briefing. Delivered as both a dashboard card and a macOS notification. Start coding with full context before you've finished your coffee.
- 07.
Agent Pulse Strip
A persistent status bar showing live agent data: how many agents are running, the day's running agent cost in dollars, and a warning indicator if any agent is approaching its context window limit. Updates in real-time as agents start and stop. Clicking opens the Agent Hub directly — no navigation required.
- 08.
Widget Categories Deep Dive
Vercel: active builds badge, avg build time, success rate, error cards, production health, deployment timeline. Stripe: MRR, ARR, churn rate, active customers, recent charges, subscription breakdown, disputes, failed payments. GitHub: PR count, open issues, recent commits, Actions status, notification count. Sentry: unresolved issues, crash-free rate, error frequency, release health, p95 response time. PostHog: event trending, DAU/WAU/MAU, feature flag status, funnel completion. Linear: cycle progress, velocity, milestone tracking. Plus Firebase, Supabase, Google Workspace, Slack, Notion, Netlify, Render, Railway, and engine health widgets.
- 09.
Named Layouts & Persistence
Save unlimited named dashboard layouts and switch between them instantly. Your 'Sprint Planning' layout surfaces Linear and GitHub widgets. Your 'Deploy Day' layout leads with Vercel and Sentry. Your 'Revenue Review' layout is all Stripe and PostHog. Layouts persist across launches and survive app updates. The grid system enforces full-row alignment so every layout looks clean regardless of widget combination.